DATA + MATERIAL INSTALLATION · 2026
Melting Pulse
Translating the silent disappearance of glaciers into tangible data and bio-material installations.
01
Data Visualization
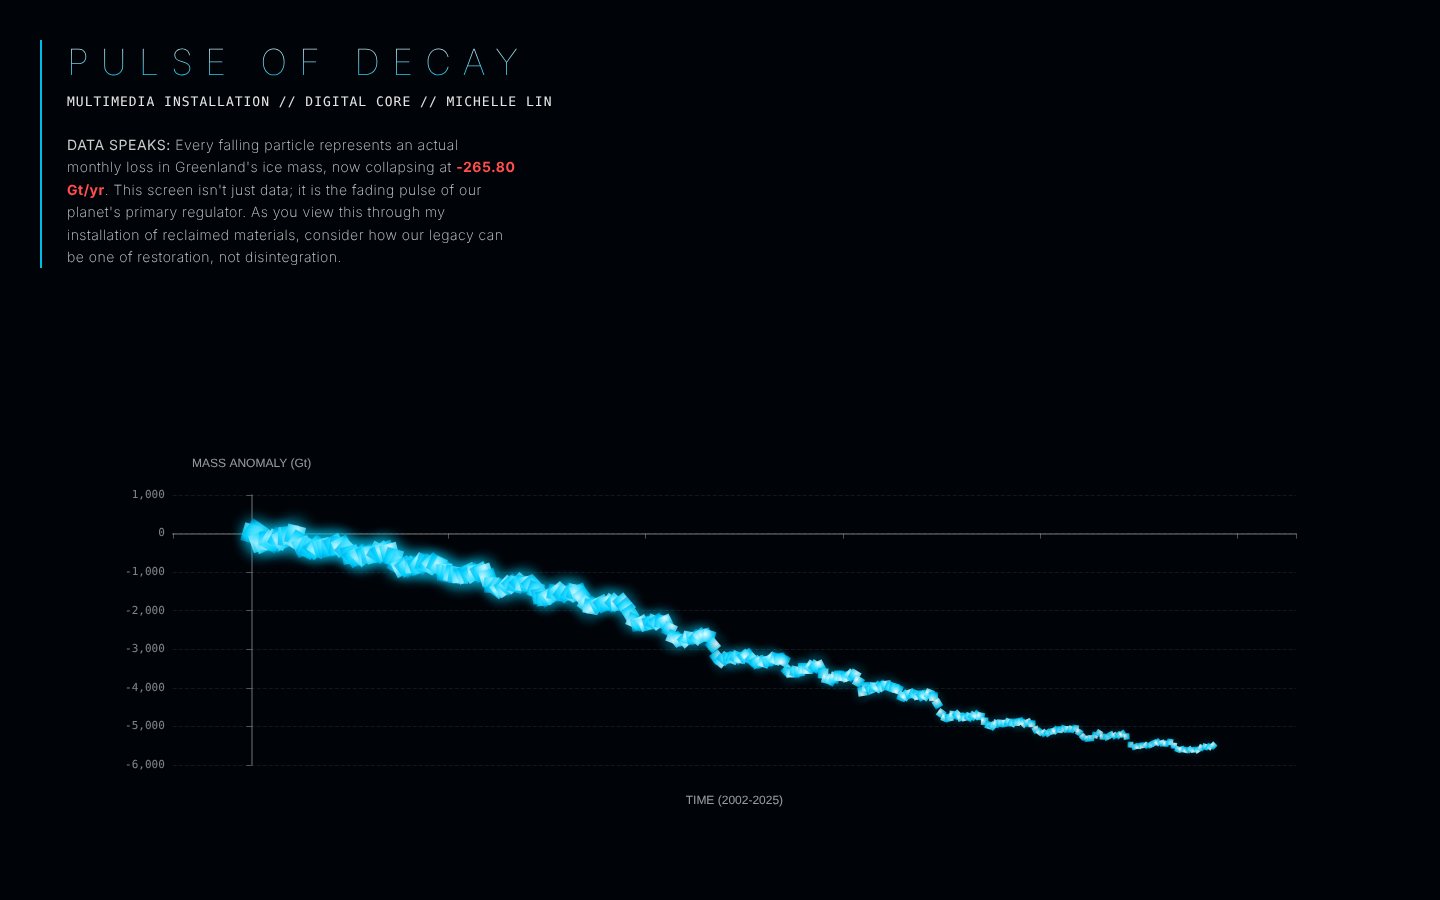
Charts make climate loss feel abstract. Python scripts clean and normalise NASA GRACE Greenland ice-mass data (2002–2025). Three web versions explore the same dataset: a dashboard, a scroll narrative and a particle field.
02
Materiality
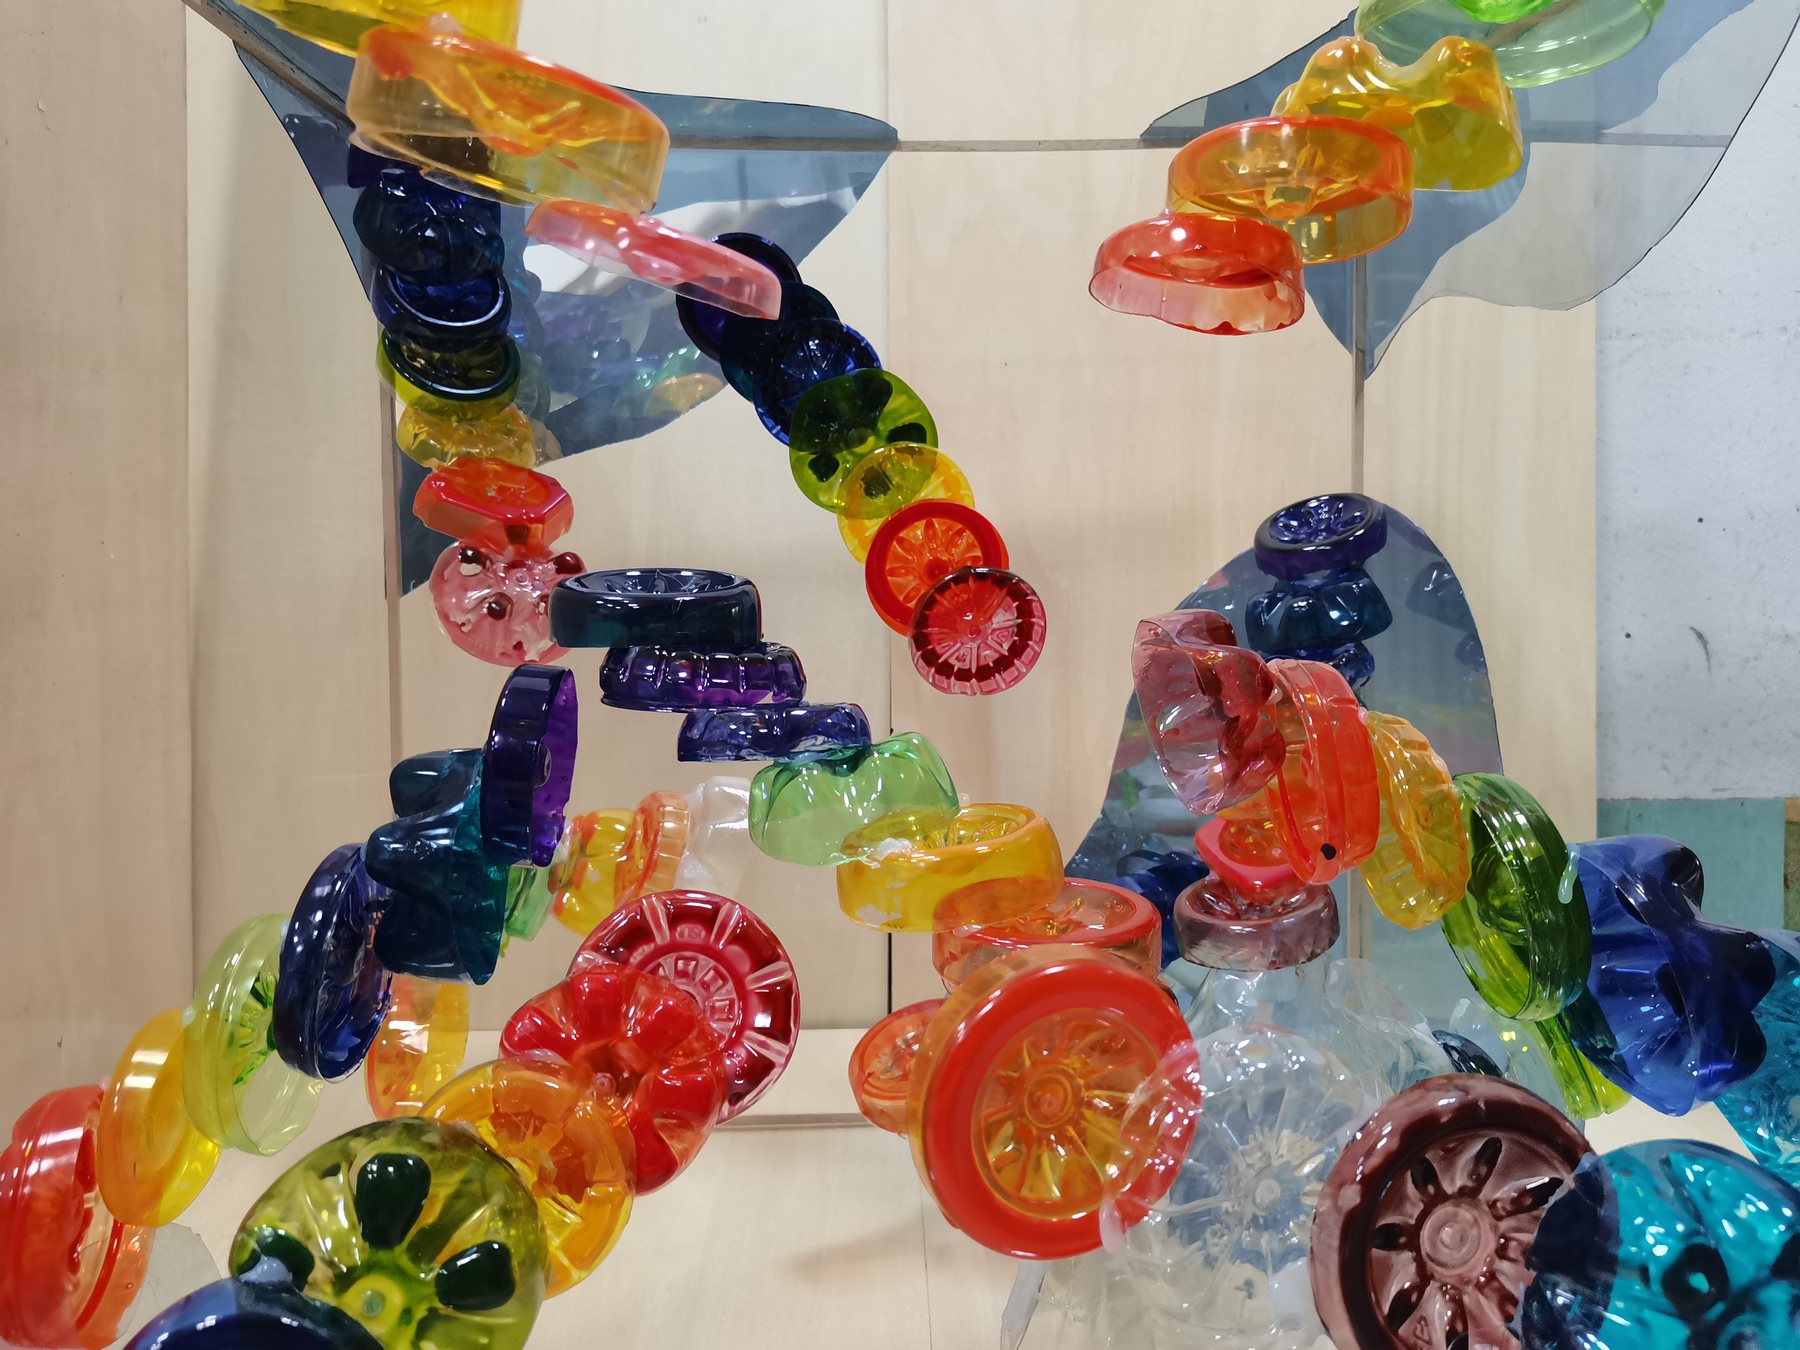
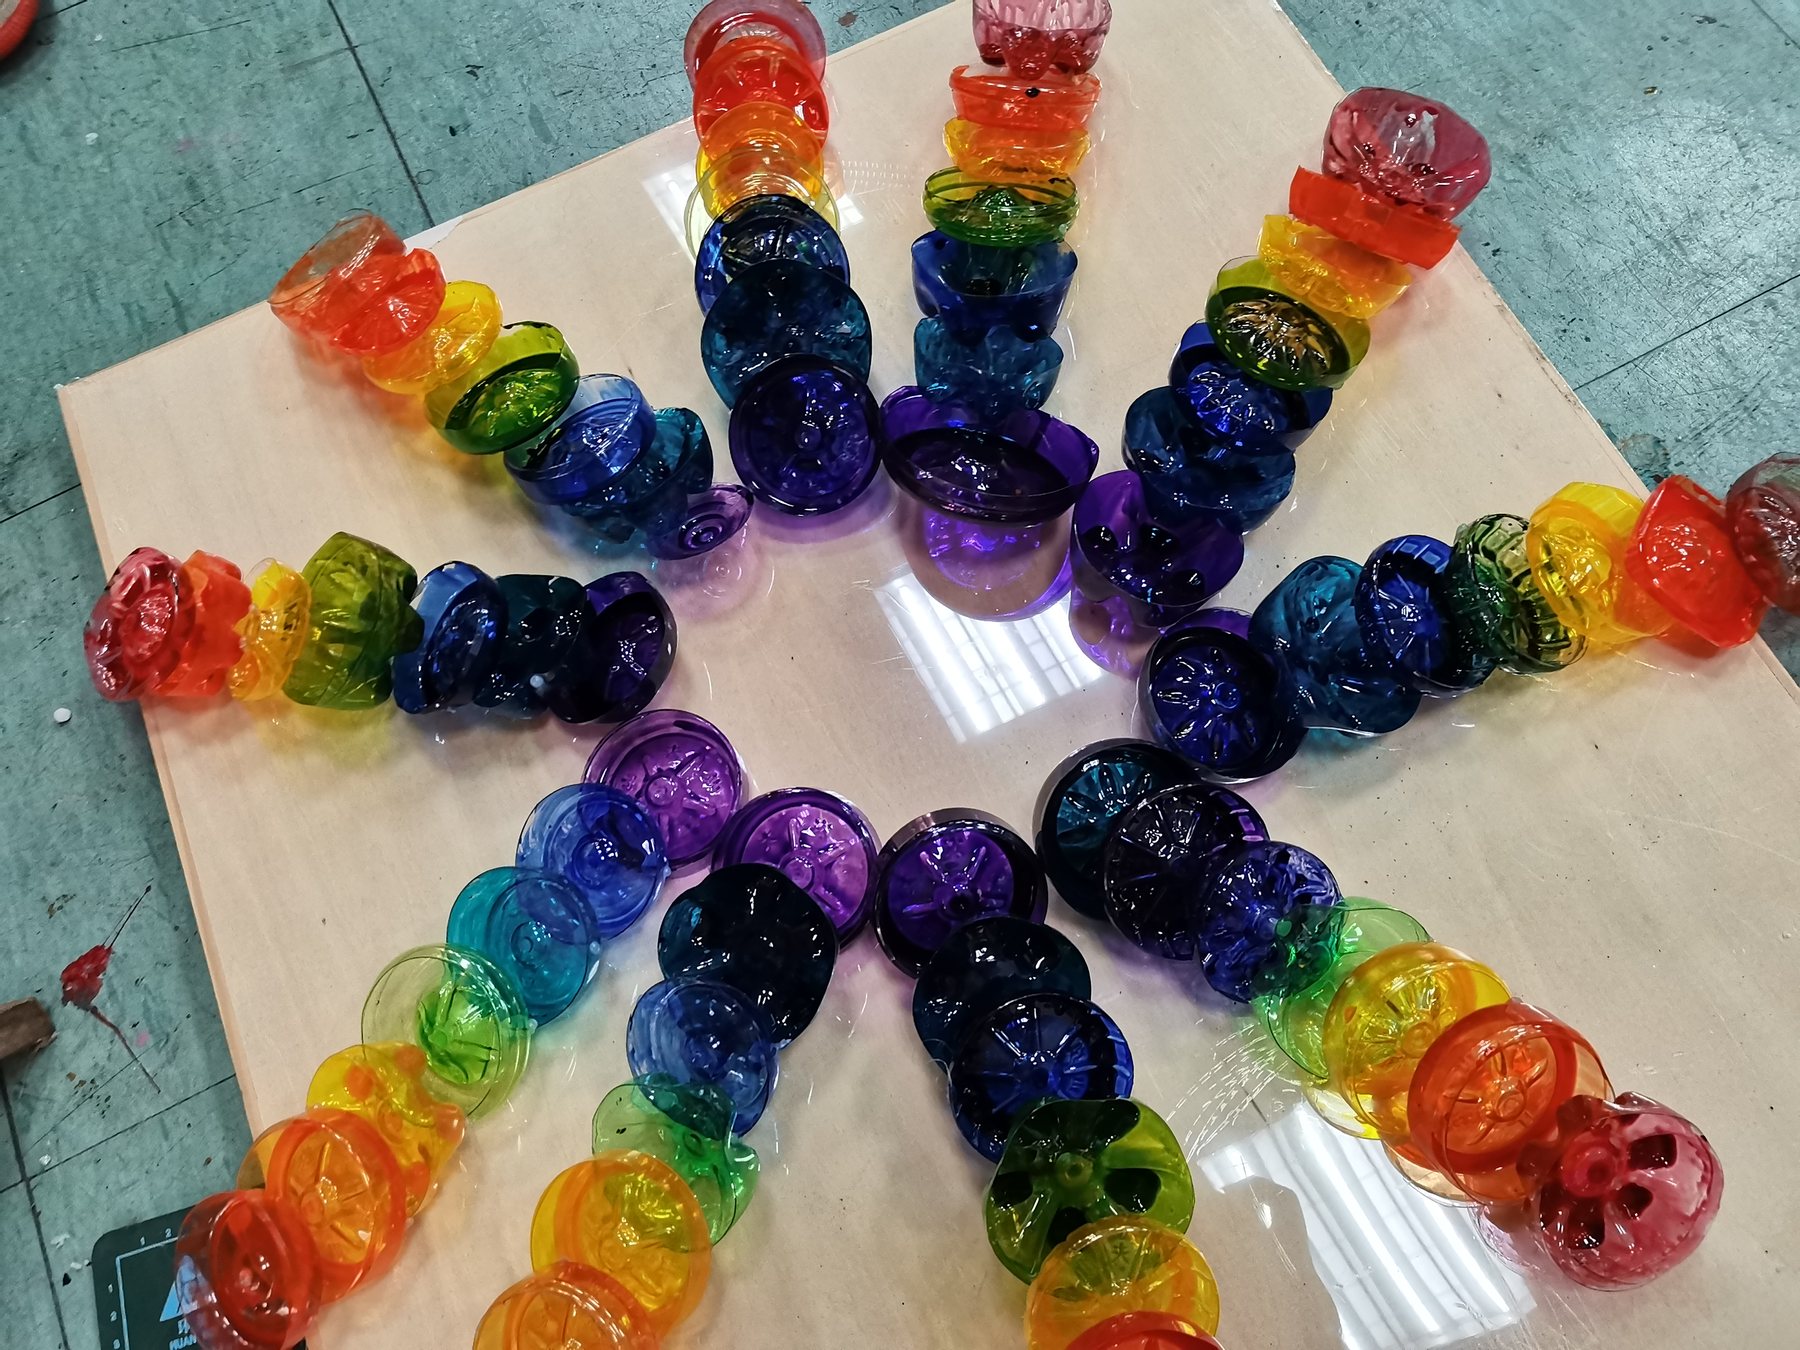
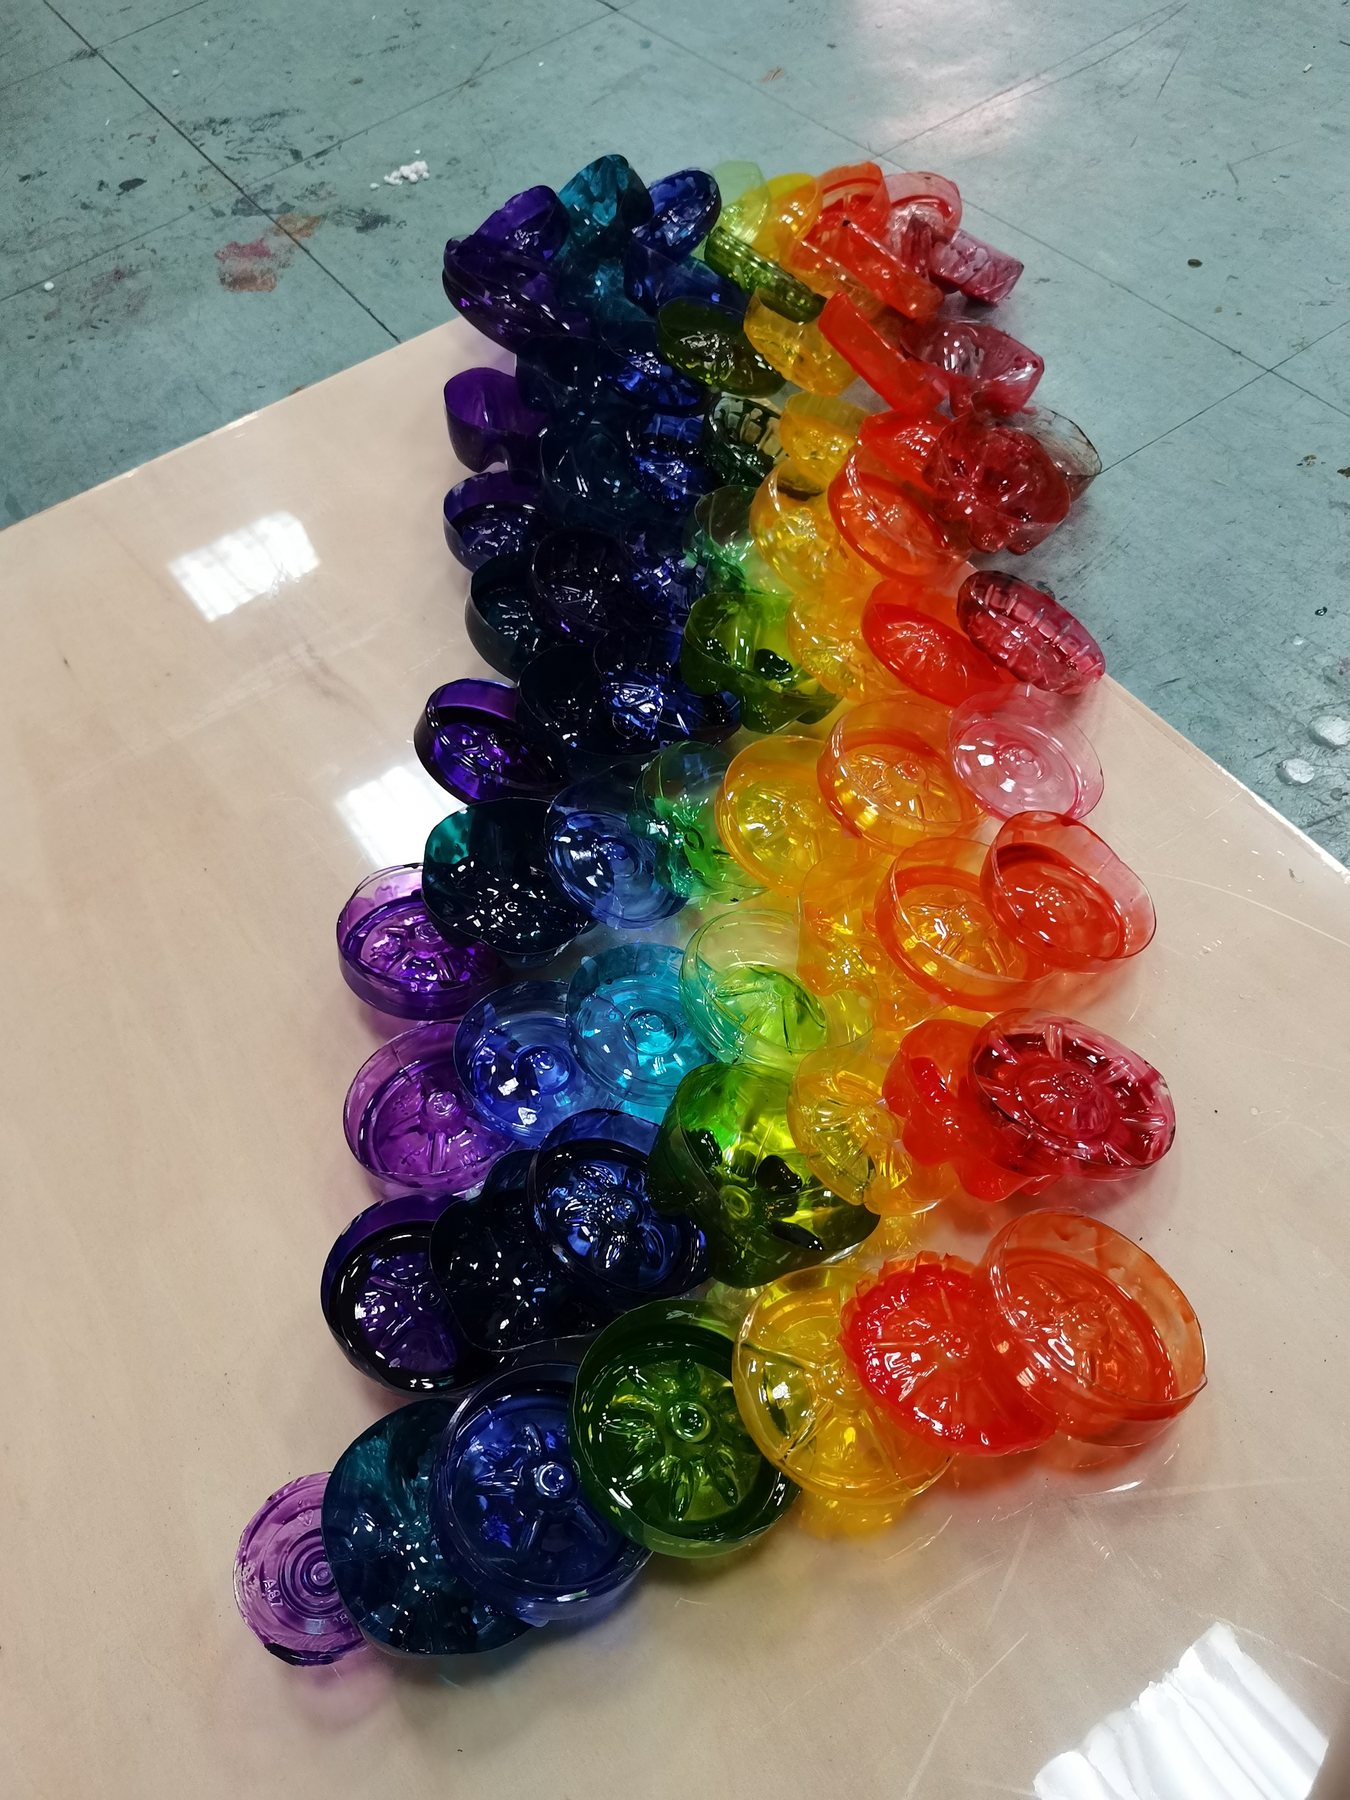
Eco-friendly materials, bioplastics and recycled polymers were tested as the body of the piece, so the material itself carries the story of loss.
03
The Installation
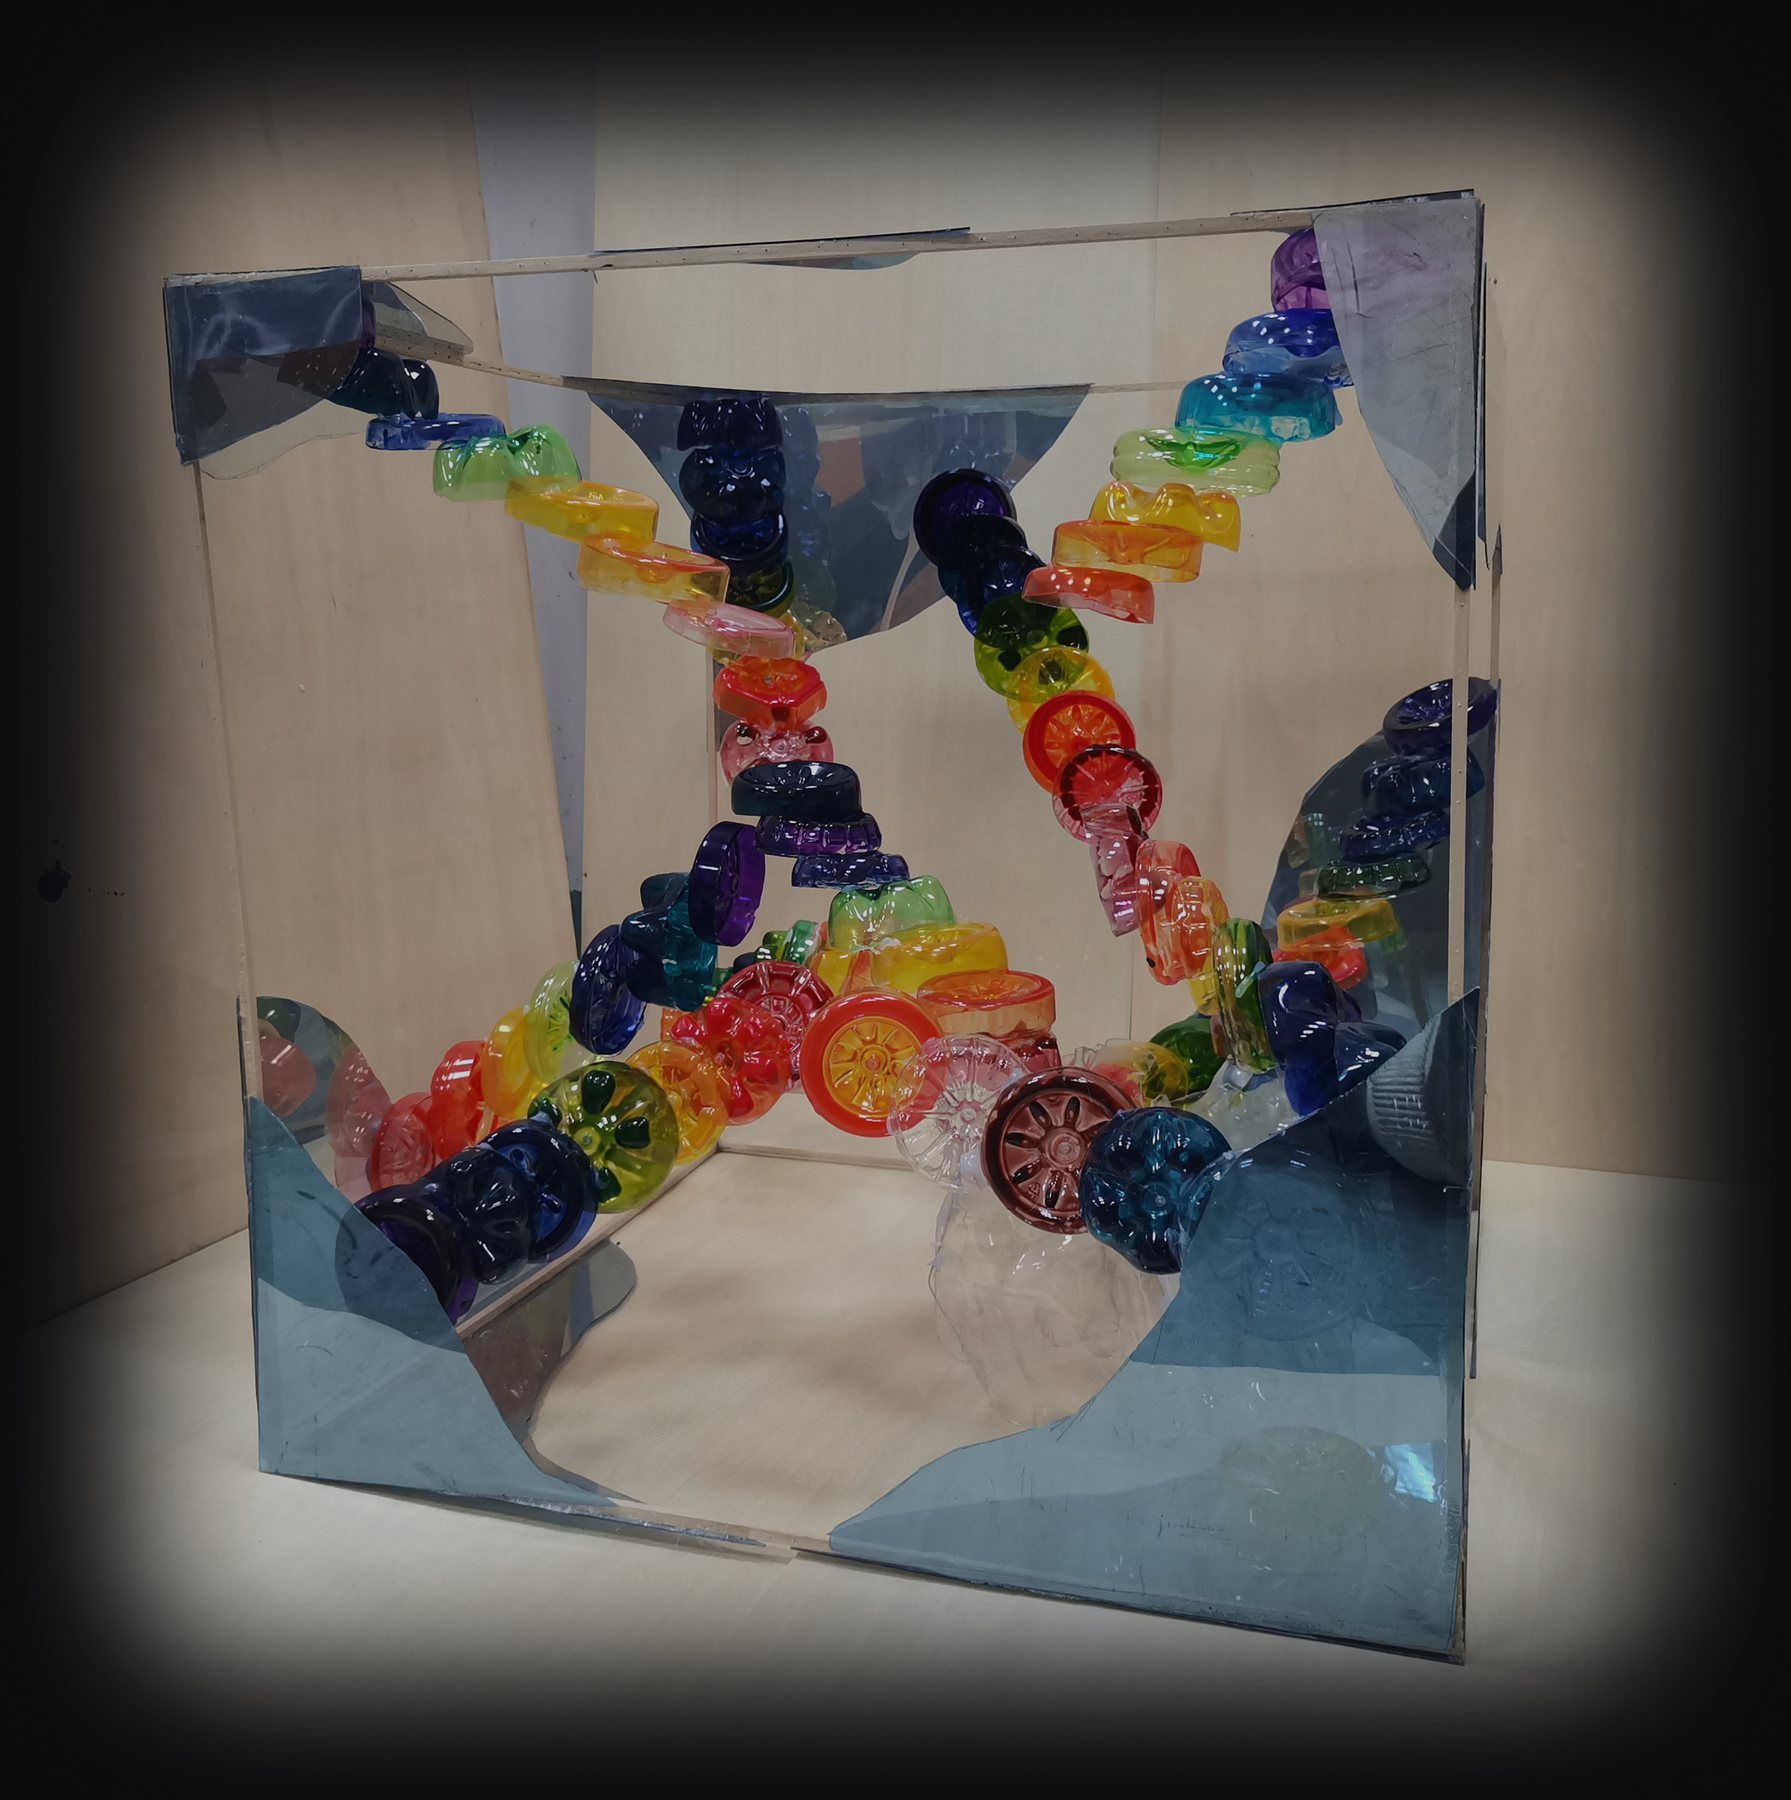
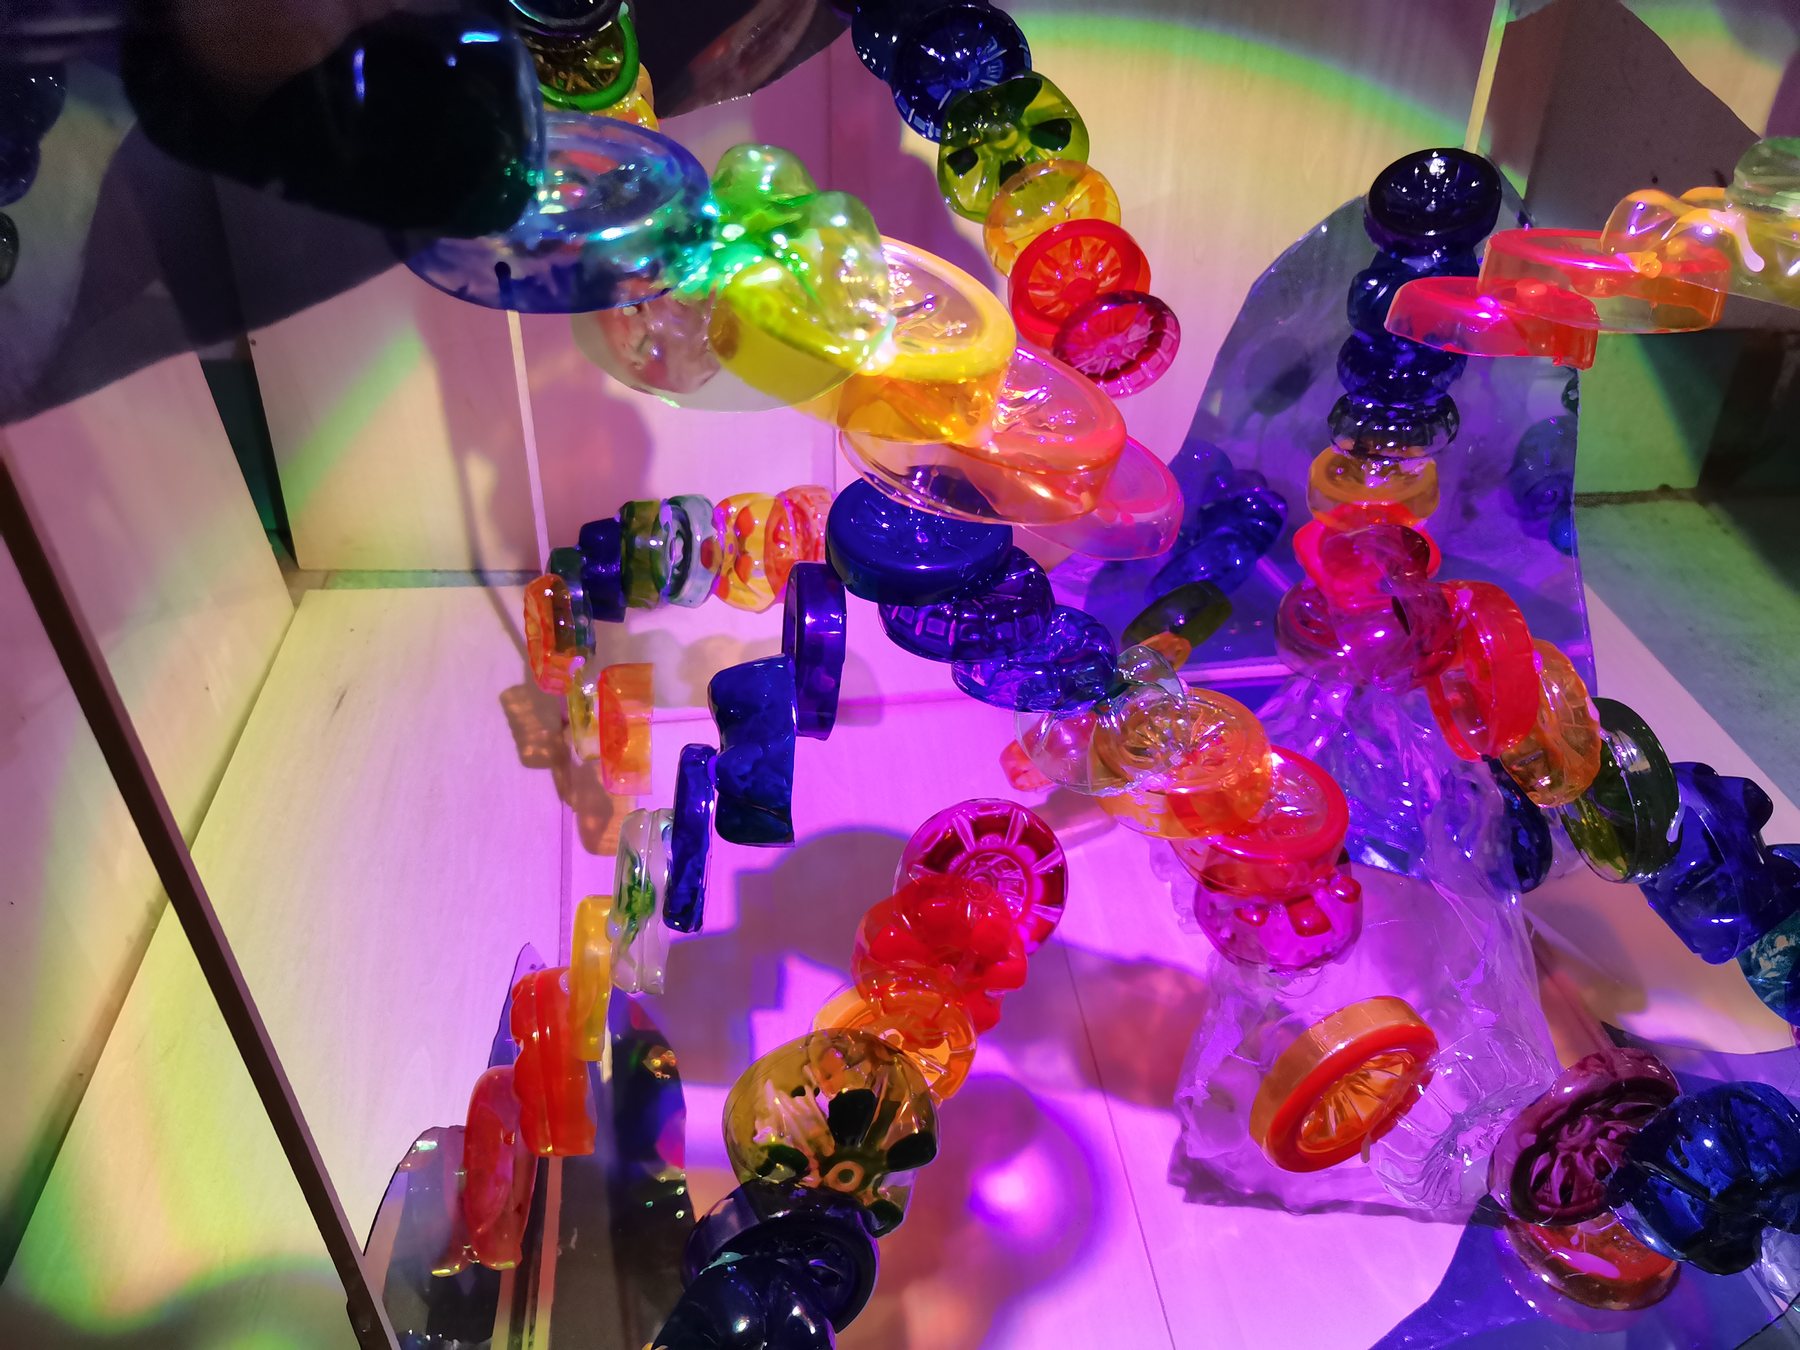
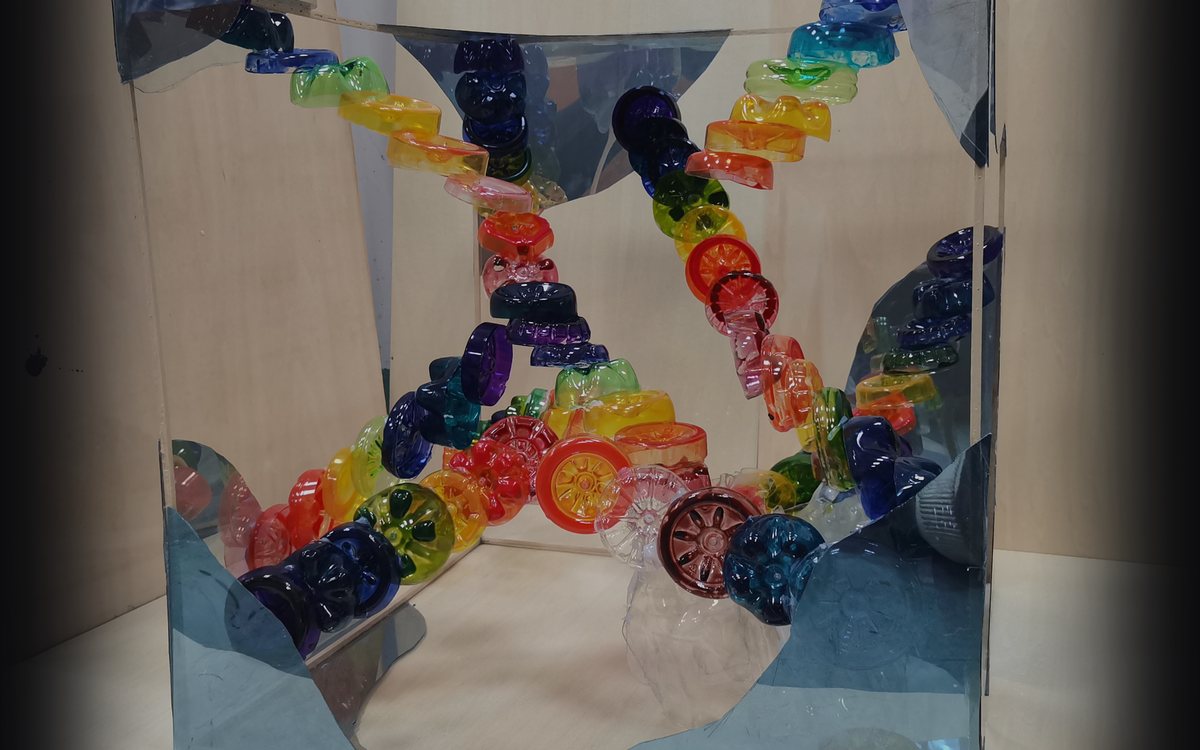
Cast components map the melt data into color and form: temperature rise becomes light, melt rate becomes gradient, mass loss becomes material decay.